地図データを扱うJavaScript ライブラリ「Leaflet」を使って、地図表示を試してきた。
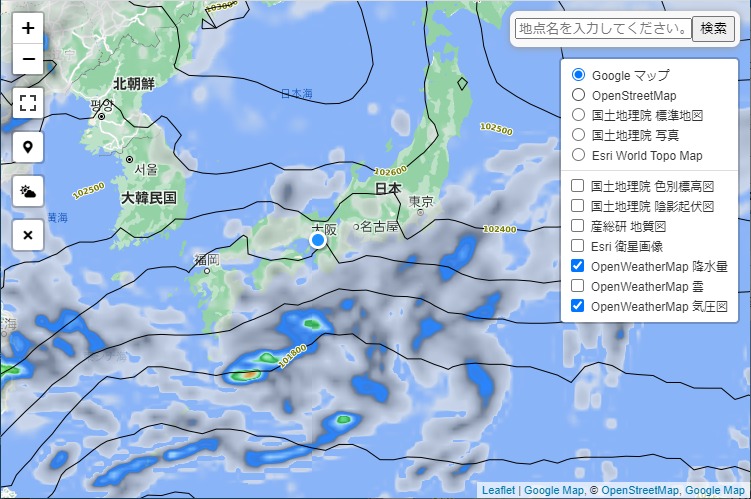
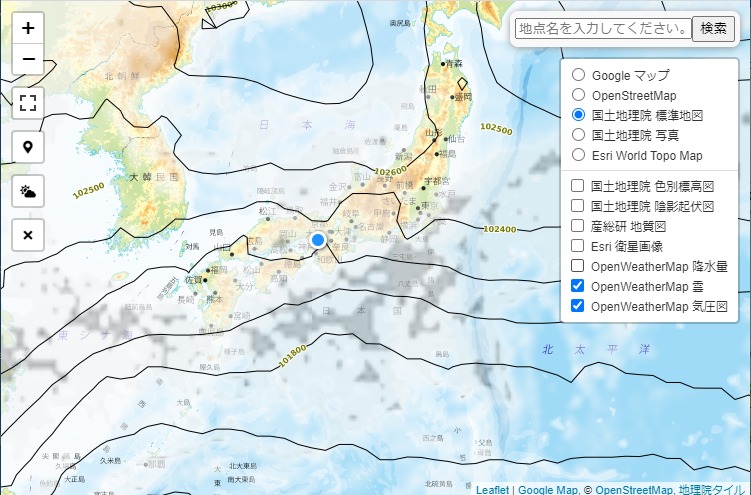
今回、「OpenWeatherMap」の降水量、雲、気圧図を重ねて表示できるようにした。
APIキーが見えてしまうので、作成したページはとりあえず非公開。
【サンプルソース抜粋】
var Overlay_Map = new Array();
...
...
...
Overlay_Map[ 4 ] = L.tileLayer('https://tile.openweathermap.org/map/precipitation/{z}/{x}/{y}.png?appid={APIキー}', {
	opacity: 0.5,
	attribution: '<a href="https://openweathermap.org/">OpenWeather</a>'
});
Overlay_Map[ 5 ] = L.tileLayer('https://tile.openweathermap.org/map/clouds/{z}/{x}/{y}.png?appid={APIキー}', {
	opacity: 1.0,
	attribution: '<a href="https://openweathermap.org/">OpenWeather</a>'
});
Overlay_Map[ 6 ] = L.tileLayer('https://tile.openweathermap.org/map/pressure_cntr/{z}/{x}/{y}.png?appid={APIキー}', {
	opacity: 1.0,
	attribution: '<a href="https://openweathermap.org/">OpenWeather</a>'
});
var overlay = {
	...
	...
	...
	'OpenWeatherMap 降水量': Overlay_Map[ 4 ],
	'OpenWeatherMap 雲': Overlay_Map[ 5 ],
	'OpenWeatherMap 気圧図': Overlay_Map[ 6 ]
};
L.control.layers(baseMap, overlay).addTo(map);
【画面イメージ】
降水量、雲、気圧図いずれも精度は低いかもしれない。