先日、Leafletで世界地図に国別宗教構成を表示するページを作成した。
前回は、世界地図に国旗を表示し、国旗をクリックすると、その国の宗教構成を表示する方式だった。
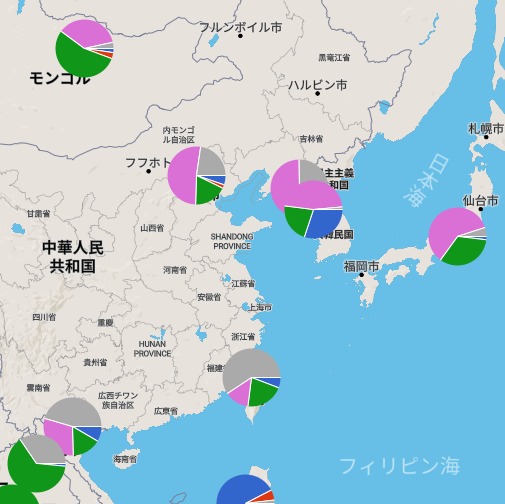
今回は、全世界の各国の宗教構成を円グラフで一覧表示する方式にした。

宗教構成データは、前回と同じく「Religious Composition by Country, 2010-2050 - Pew Research Center」の2020年データを使用。
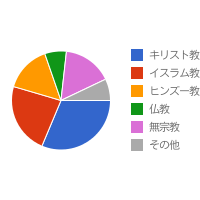
このデータによれば、全世界では、
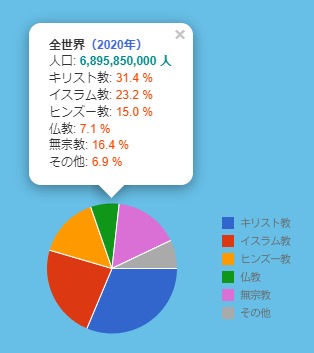
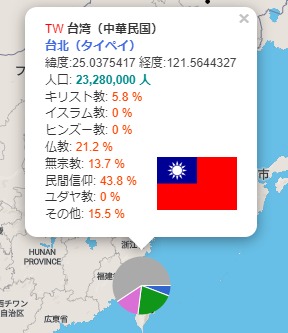
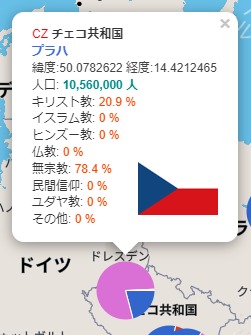
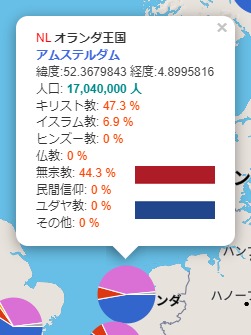
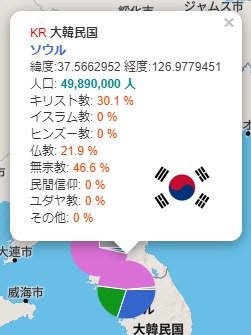
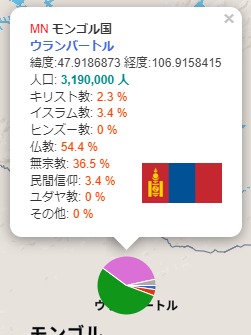
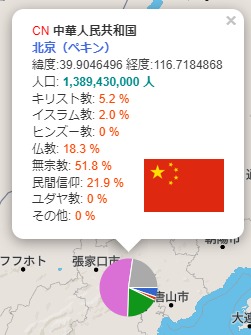
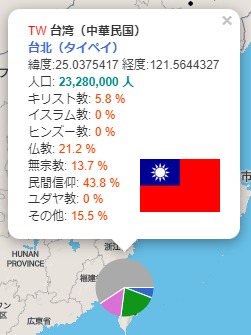
各国の円グラフをクリックすると、宗教構成を数字で表示する。民間信仰やユダヤ教は、円グラフでは「その他」に入れている。このデータでは、道教、儒教等は民間信仰に含まれている。
このデータによれば、ヨーロッパや東アジアでは無宗教(ピンク色表示)の比率が高い。
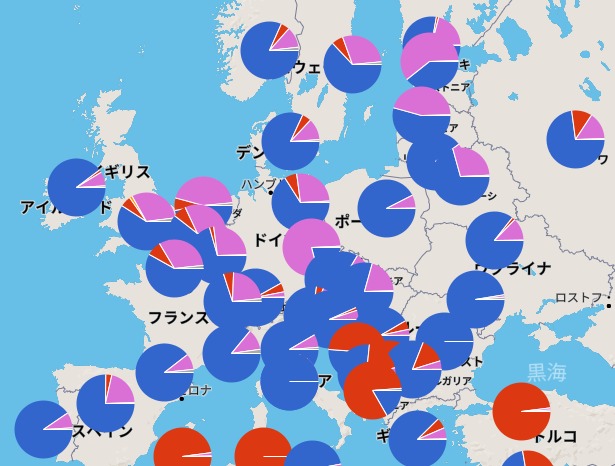
アフリカは北部と南部で大きく分かれる。北部はイスラム教(赤色表示)が大半。南部はキリスト教(青色表示)が大半。
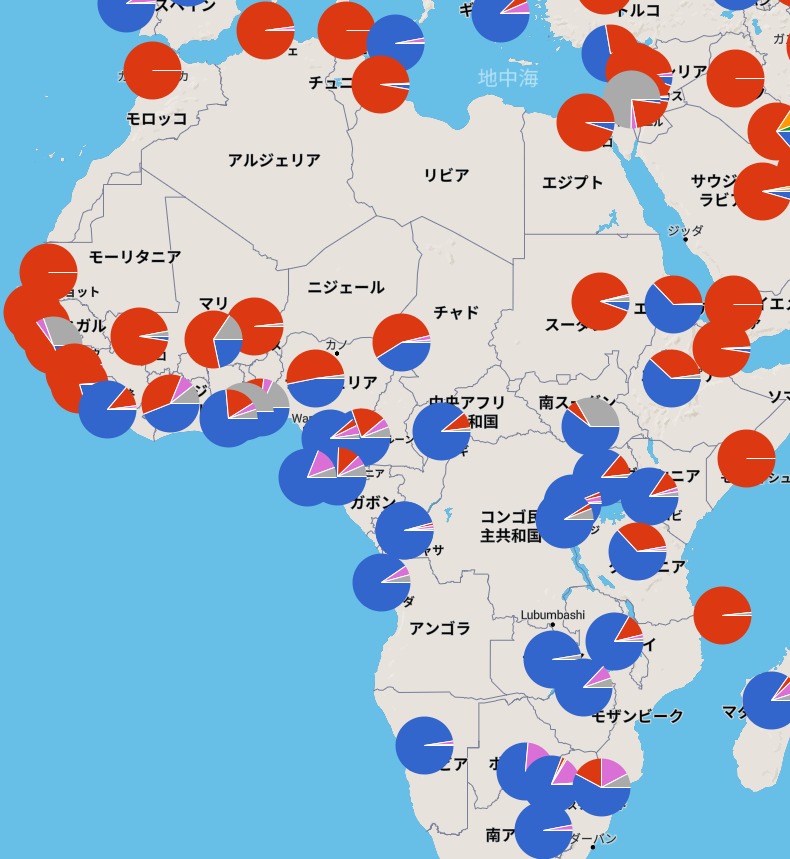
仏教(緑色表示)は東南アジアから東アジア。
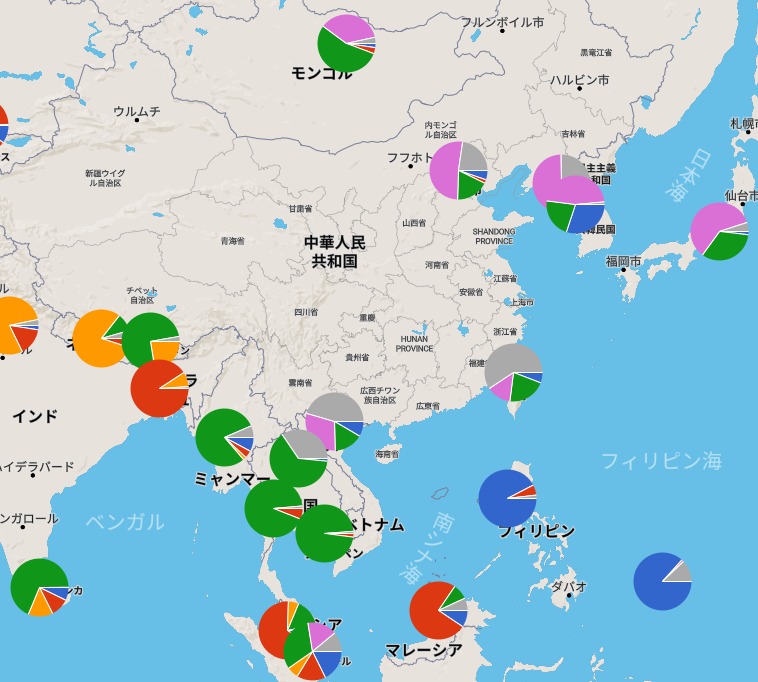
中国や台湾では民間信仰の比率が高いが、民間信仰には道教や儒教が含まれる。民間信仰は円グラフ上では「その他(グレー色)」に入っている。
円グラフには「Google Charts > Image Charts」を使っている。(ただし、非推奨になっているようなので、そのうち使えなくなるかもしれない。)
URLでパラメーター指定でPNG画像で円グラフを取得できる。
https://chart.apis.google.com/chart?cht=p&chs=200x200&chco=3366CC|DC3912|FF9900|109618|da70d6|aaaaaa&chf=bg,s,ffffff00&chd=t:31,23,15,7,16,7&chdl=キリスト教|イスラム教|ヒンズー教|仏教|無宗教|その他
≪JavaScriptソース抜粋≫
function csv2map(csv) {
	var chartIcon;
	var line = csv.split("\n");
	for (var i=0; i<line.length; ++i) {
		var data = line[i].split('\t');
		if (data.length > 2) {
/*
			data[0]	country_code
			data[1]	name_jp
			data[3]	capital_jp
			data[7]	lat
			data[8]	lon
*/
			var country_code = data[0].toUpperCase();
			var popStr = '<div class="country_box">';
			popStr += '<img class="flag" src="worldflags/80px/' + data[0].toLowerCase() + '.png">';
			popStr += '<span class="country_code">' + country_code + '</span> ';
			popStr += '<span class="country">' + data[1] + '</span><br>';
			popStr += '<span class="capital">' + data[3] + '</span><br>';
			popStr += '<span class="lat_lng">緯度:' + data[7] + ' 経度:' + data[8] + '</span>';
			if (country[country_code]) {
/*
				country[0] 国名
				country[1] 人口
				country[2] キリスト教
				country[3] イスラム教
				country[4] 無宗教
				country[5] ヒンズー教
				country[6] 仏教
				country[7] 民間信仰
				country[8] ユダヤ教
				country[9] その他
*/
				popStr += '<br>人口: <span class="population">' + Number(country[country_code] [1]).toLocaleString() + ' 人</span>';
				popStr += '<br>キリスト教: <span class="religion">' + country[country_code] [2] + ' %</span>';
				popStr += '<br>イスラム教: <span class="religion">' + country[country_code] [3] + ' %</span>';
				popStr += '<br>ヒンズー教: <span class="religion">' + country[country_code] [5] + ' %</span>';
				popStr += '<br>仏教: <span class="religion">' + country[country_code] [6] + ' %</span>';
				popStr += '<br>無宗教: <span class="religion">' + country[country_code] [4] + ' %</span>';
				popStr += '<br>民間信仰: <span class="religion">' + country[country_code] [7] + ' %</span>';
				popStr += '<br>ユダヤ教: <span class="religion">' + country[country_code] [8] + ' %</span>';
				popStr += '<br>その他: <span class="religion">' + country[country_code] [9] + ' %</span>';
				popStr += '</div>';
				var pie_data = country[country_code] [2];		// キリスト教
				pie_data += ',' + country[country_code] [3];		// イスラム教
				pie_data += ',' + country[country_code] [5];		// ヒンズー教
				pie_data += ',' + country[country_code] [6];		// 仏教
				pie_data += ',' + country[country_code] [4];		// 無宗教
				pie_data += ',' + (100 - Number(country[country_code] [2]) - Number(country[country_code] [3]) - Number(country[country_code] [5]) - Number(country[country_code] [6]) - Number(country[country_code] [4]));		// その他
				chartIcon = L.icon({
					iconUrl: 'https://chart.apis.google.com/chart?cht=p&chs=80x80&chco=3366CC|DC3912|FF9900|109618|da70d6|aaaaaa&chf=bg,s,ffffff00&chd=t:' + pie_data,
					iconSize: [80, 80],
					iconAnchor: [50, 50],
					popupAnchor: [-10, -45]
				});
				L.marker([data[7],data[8]],{icon:chartIcon}).addTo(map).bindPopup(popStr);
			}
		}
	}
}